Grafana Dashboard
This tutorial will show you how to encapsulate Prometheus standard API and use them to monitor state of pgmoneta with the help of Grafana dashboard.
Preface
This tutorial assumes that you have an installation of PostgreSQL 13+ and pgmoneta.
See Install pgmoneta for more detail.
Prometheus Configuration
First of all, you should install Prometheus in your pgmoneta server.
After you successfully installed Prometheus, you should replace prometheus.yml with the content below to configure how to query your pgmoneta metrics.
scrape_configs:
  - job_name: 'pgmoneta'
    metrics_path: '/metrics'
    static_configs:
- targets: ['localhost:5001']scrape_configs:
- job_name: 'pgmoneta'
metrics_path: '/metrics'
static_configs:
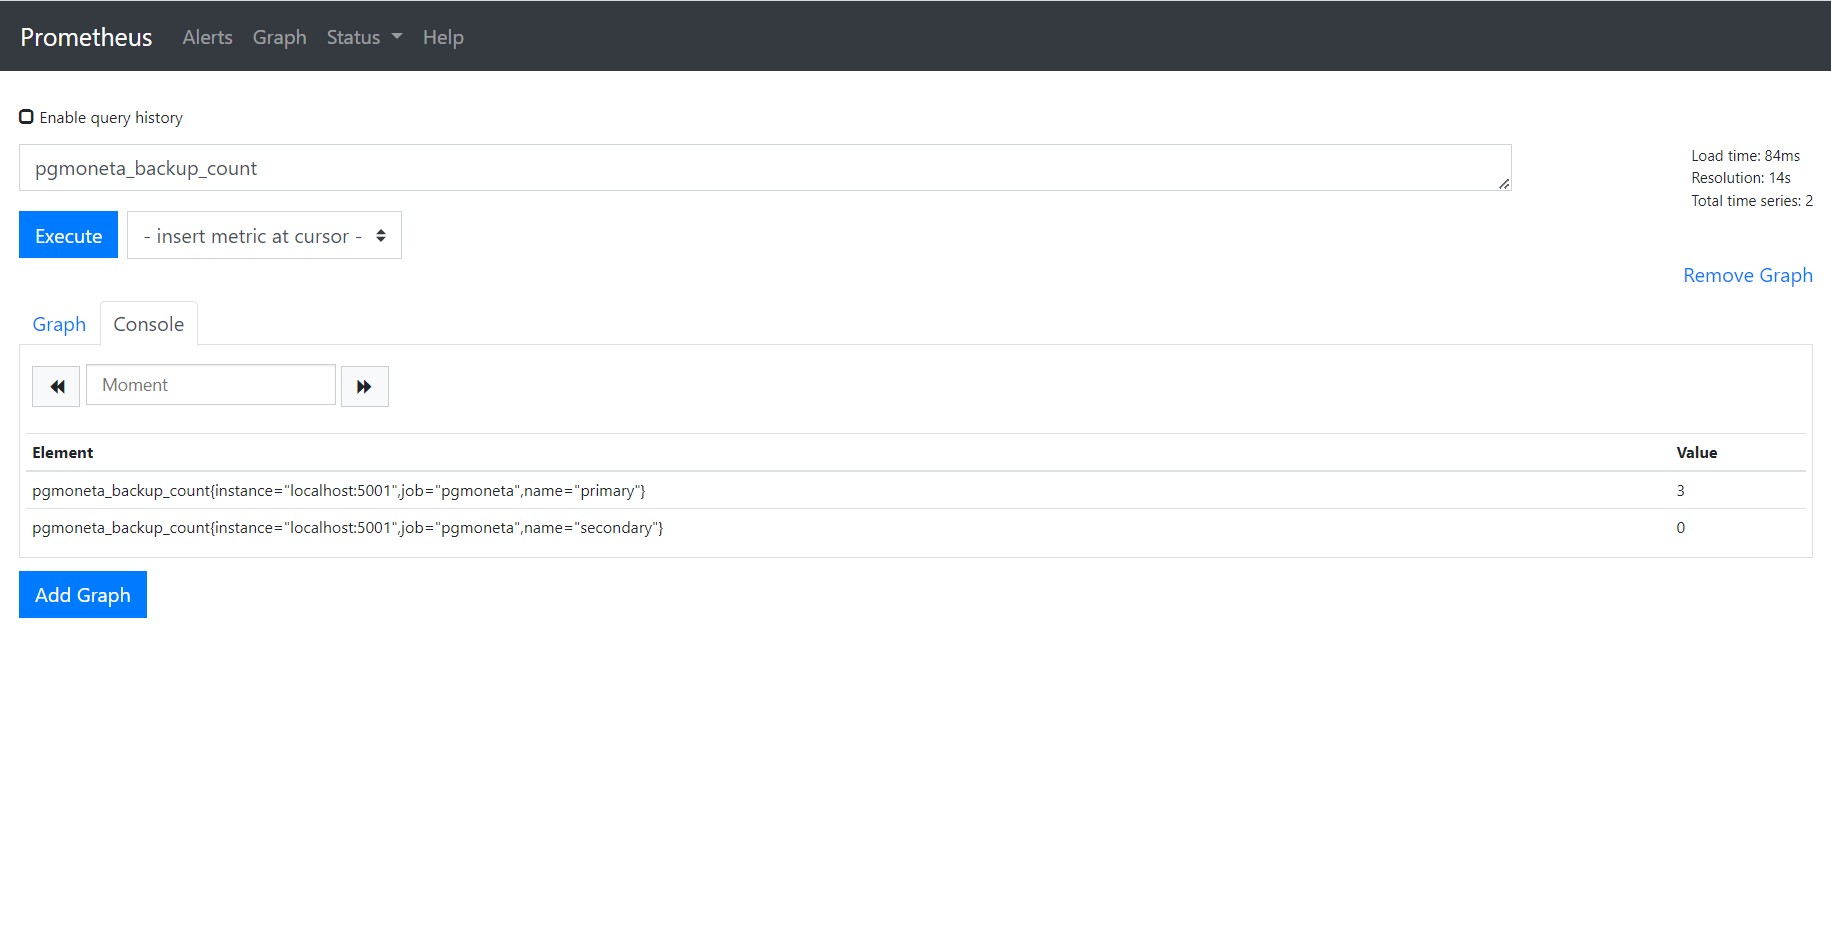
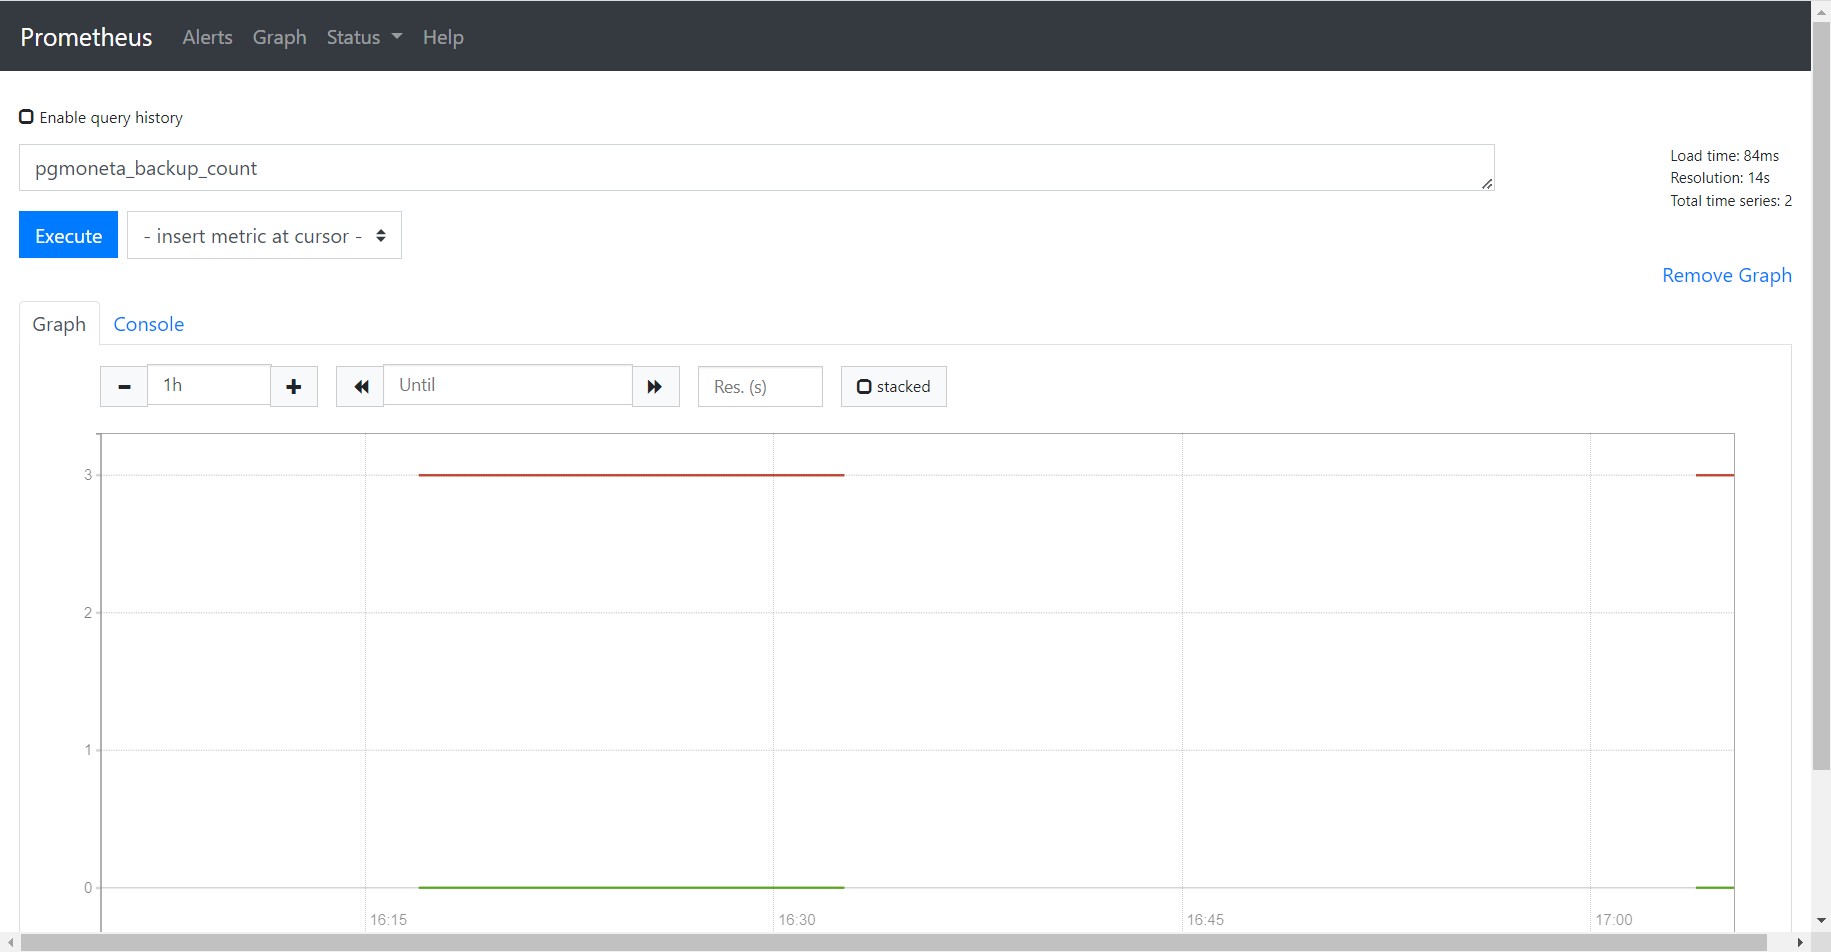
- targets: ['localhost:5001']Then the Prometheus service will query your pgmoneta metrics every 15 seconds and package them as time-series data. You can query your pgmoneta metrics and watch their changes as time passed in Prometheus web page (default port is 9090).
Grafana Dashboard Import
Although Prometheus provides capacity of querying and monitoring metrics, we can not customize graphs for each metric and provide a unified view.
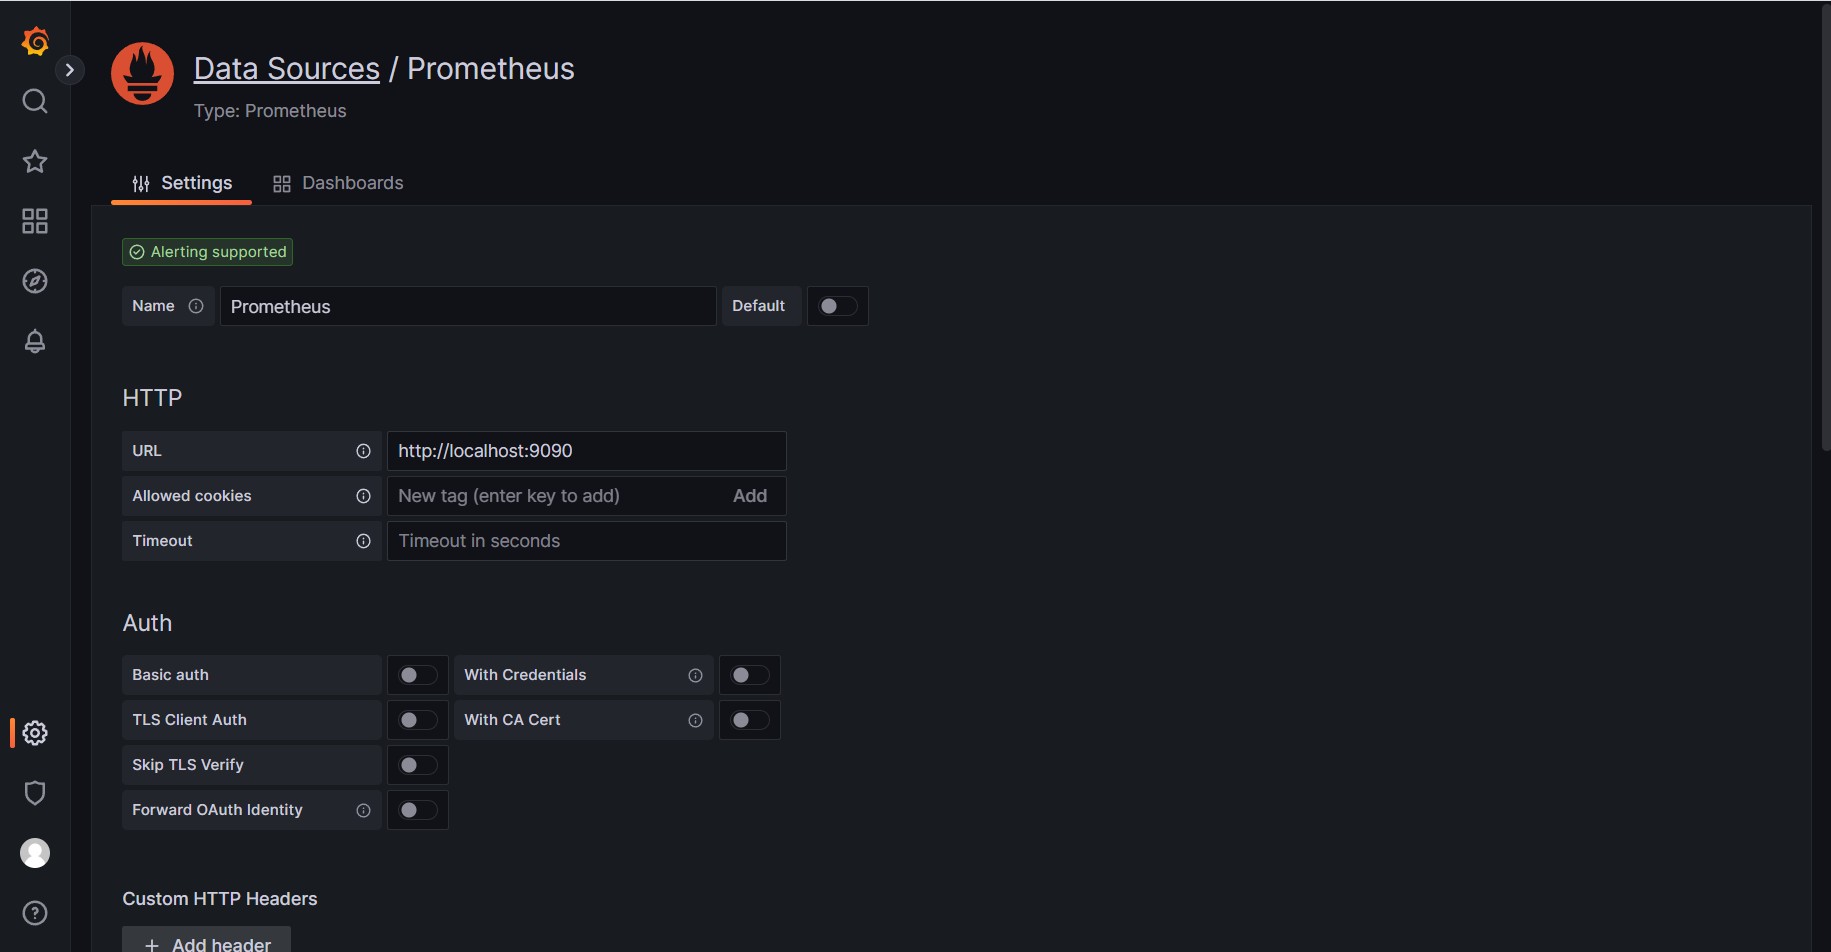
As a result, we use Grafana to help us manage all graphs together. First of all, we should install Grafana in the computer you need to monitor pgmoneta metrics. You can browse Grafana web page with default port 3000, default user admin and default password admin. Then you can create Prometheus data source of pgmoneta.
Finally you can create dashboard by importing contrib/grafana/dashboard.json and monitor metrics about pgmoneta.
